Simple tesseroid model
The files in the folder cookbook/simple_tess show how to calculate the
gravitational fields of a simple 2 tesseroid model at 260 km height.
For this simple setup, the model file looks like this:
# Test tesseroid model file
10 20 10 20 0 -50000 200
-20 -10 -20 -10 0 -30000 -500
The simple_tess.sh script performs the calculations and calls the
plot.py script to plot the results:
#!/bin/bash

# Generate a regular grid, pipe it to all the computation programs,
# and write the result to output.txt

tessgrd -r-45/45/-45/45 -b101/101 -z260e03 | \
tesspot model.txt | \
tessgx model.txt | tessgy model.txt | tessgz model.txt | \
tessgxx model.txt  | tessgxy model.txt  | \
tessgxz model.txt  | tessgyy model.txt  | \
tessgyz model.txt  | tessgzz model.txt -v -llog.txt > output.txt

# Make a plot with the columns of output.txt
python plot.py output.txt 101 101
tessgrd generates a regular grid and prints that to standard output
(stdout).
The scripts pipes the grid points to tesspot etc. to calculate the
corresponding fields.
Option -v tells tessgzz
to print information messages (to stderr).
Option -llog.txt tells tessgzz
to log the information plus debug messages
to a file called log.txt.
The columns of the output file will be, respectively: longitude, latitude, height, potential, gx, gy, gz, gxx, gxy, gxz, gyy, gyz, and gzz. The result should look like this (“column” means the column of the output file):
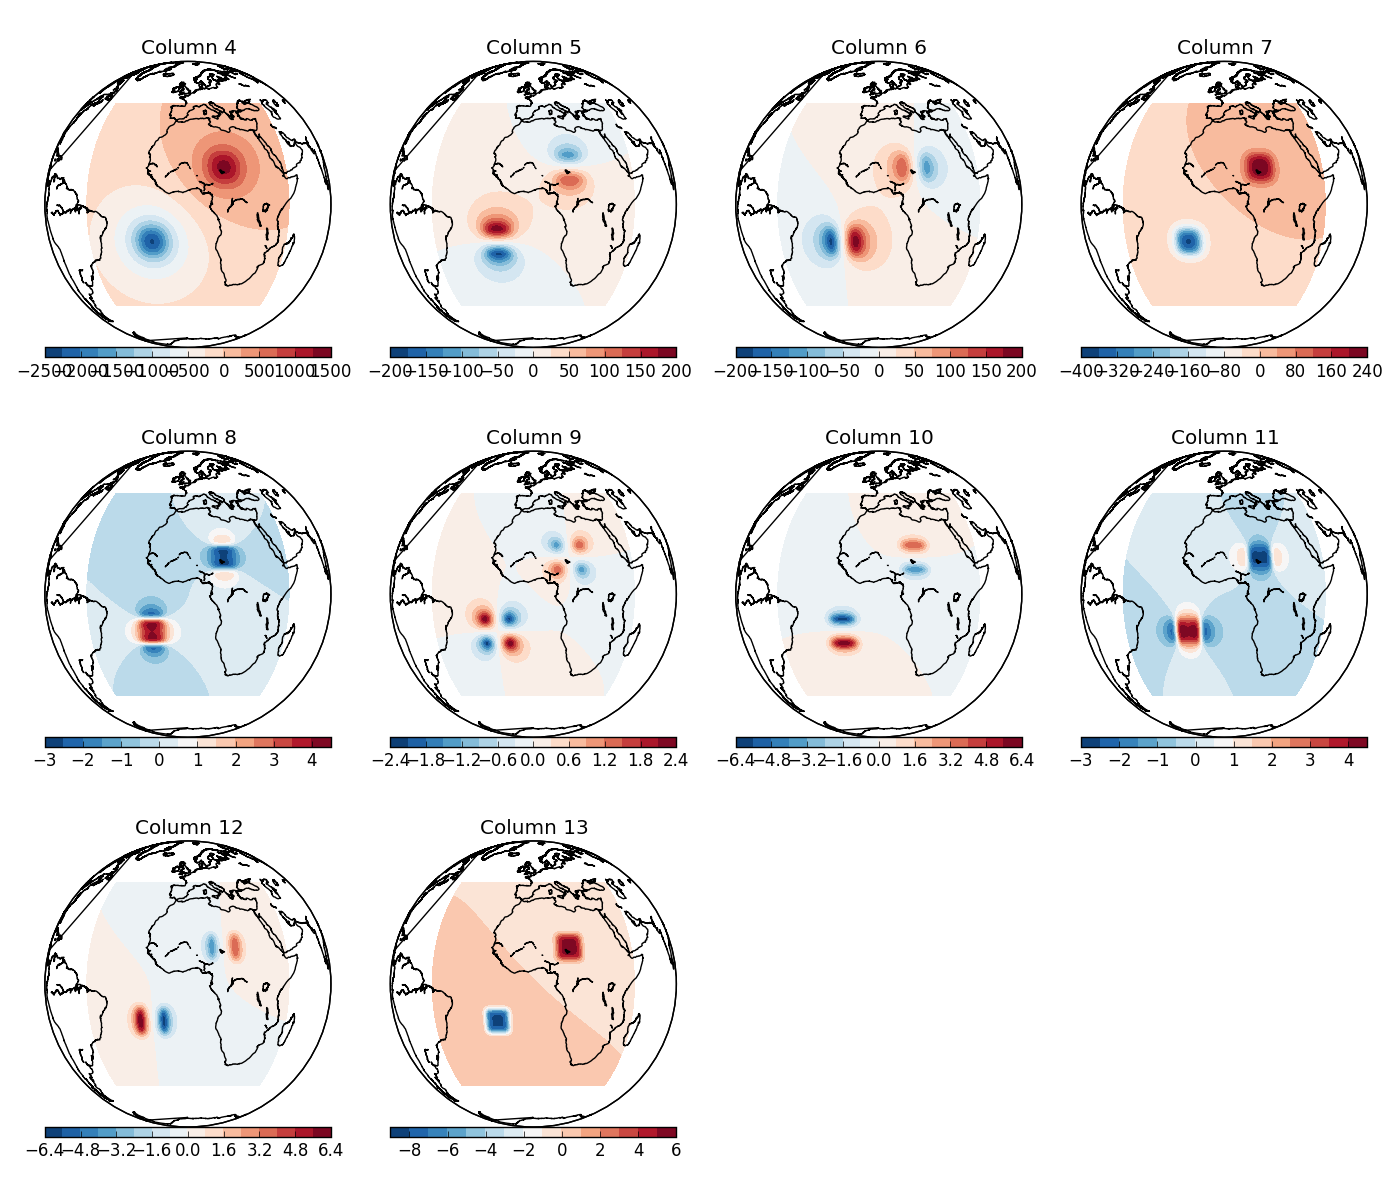
Plot of the columns of output.txt generated by simple_tess.sh.
Orthographic projection
(thanks to the Basemap toolkit of matplotlib).