Using tesslayers to make a tesseroid model of a stack of layers
The tesslayers.sh script converts
grids that define a stack of layers
into a tesseroid model.
It then calculates
the gravitational attraction
and gravity gradient tensor due to the tesseroid model:
#!/bin/bash

# Convert the layer grids in layers.txt to tesseroids.
# The grid spacing passed to -s is used as the size of the tesseroids,
# so be careful!
tesslayers -s0.5/0.5 -v < layers.txt > tessmodel.txt

# Now calculate the gz and tensor effect of this model at 100km height
tessgrd -r-8/8/32/48 -b50/50 -z100000 | \
tessgz tessmodel.txt | \
tessgxx tessmodel.txt | tessgxy tessmodel.txt | \
tessgxz tessmodel.txt | tessgyy tessmodel.txt | \
tessgyz tessmodel.txt | tessgzz tessmodel.txt -v > output.txt
The input file layers.txt contains
the information about the stack of layers.
It is basicaly regular grids in xyz format (i.e., in columns).
The first 2 columns in the file are
the longitude and latitude
of the grid points.
Then comes a column with the height of the first layer.
This is the height (with respect to mean Earth radius)
of the top of stack of layers.
Then comes the thickness and density of each layer.
Our layer file looks like this:
 1 # Synthetic layer model of sediments and topography
 2 #   lon   lat   height   thickness   density
 3 -10 30 800 800.002 1900
 4 -9.5 30 800 800.006 1900
 5 -9 30 800 800.016 1900
 6 -8.5 30 800 800.042 1900
 7 -8 30 800 800.105 1900
 8 -7.5 30 800 800.248 1900
 9 -7 30 800 800.554 1900
10 -6.5 30 800 801.173 1900
...
500 -7 36 798.411 814.357 1900
501 -6.5 36 796.635 830.394 1900
502 -6 36 793.262 860.866 1900
503 -5.5 36 787.236 915.303 1900
504 -5 36 777.127 1006.62 1900
505 -4.5 36 761.226 1150.26 1900
506 -4 36 737.823 1361.66 1900
507 -3.5 36 705.685 1651.98 1900
508 -3 36 664.665 2022.53 1900
509 -2.5 36 616.299 2459.43 1900
This is a synthetic layer model generated from two gaussian functions. This is what the topography (height column) and the thickness of the sediments look like:
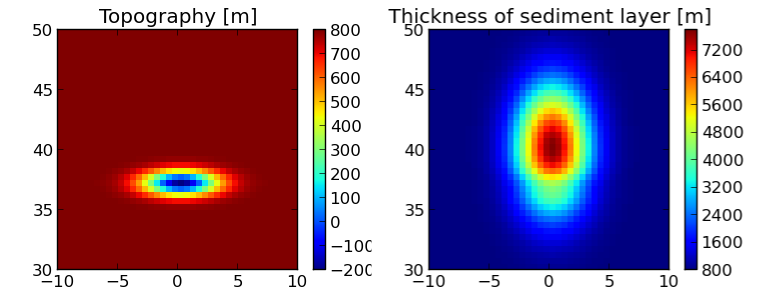
Plot of the third and forth columns of layers.txt.
The x and y axis are longitude and latitude, respectively.
The model file generated looks like this:
 1 # Tesseroid model generated by tesslayers 1.1dev:
 2 #   local time: Fri Jul 20 18:02:45 2012
 3 #   grid spacing (size of tesseroids): 0.5 deg lon / 0.5 deg lat
 4 -10.25 -9.75 29.75 30.25 800 -0.00200000032782555 1900
 5 -9.75 -9.25 29.75 30.25 800 -0.00600000005215406 1900
 6 -9.25 -8.75 29.75 30.25 800 -0.0159999998286366 1900
 7 -8.75 -8.25 29.75 30.25 800 -0.0420000003650784 1900
 8 -8.25 -7.75 29.75 30.25 800 -0.105000000447035 1900
 9 -7.75 -7.25 29.75 30.25 800 -0.247999999672174 1900
10 -7.25 -6.75 29.75 30.25 800 -0.553999999538064 1900
...
500 -7.75 -7.25 35.75 36.25 799.290000000037 -7.125 1900
501 -7.25 -6.75 35.75 36.25 798.411000000313 -15.9459999995306 1900
502 -6.75 -6.25 35.75 36.25 796.634999999776 -33.7590000005439 1900
503 -6.25 -5.75 35.75 36.25 793.262000000104 -67.6040000002831 1900
504 -5.75 -5.25 35.75 36.25 787.235999999568 -128.067000000738 1900
505 -5.25 -4.75 35.75 36.25 777.127000000328 -229.492999999784 1900
506 -4.75 -4.25 35.75 36.25 761.225999999791 -389.033999999985 1900
507 -4.25 -3.75 35.75 36.25 737.822999999858 -623.837000000291 1900
508 -3.75 -3.25 35.75 36.25 705.68499999959 -946.295000000857 1900
509 -3.25 -2.75 35.75 36.25 664.665000000037 -1357.86500000022 1900
The result should look like the following (“column” means the column of the output file).
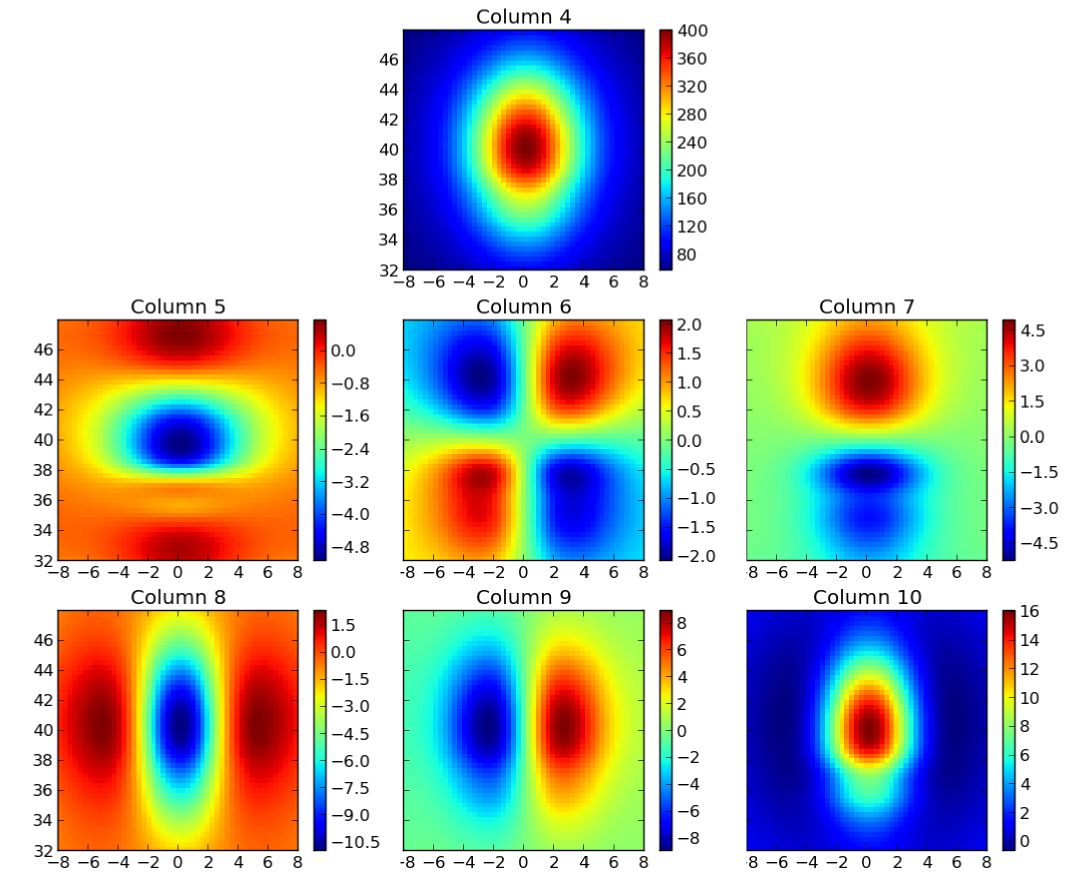
Plot of the columns of output.txt generated by tesslayers.sh.
The x and y axis are longitude and latitude, respectively.